วันพฤหัสบดีที่ 31 มกราคม พ.ศ. 2556

Trade Idea Wrap-up: EUR/USD – Buy at 1.3485

Candlesticks and Ichimoku Intraday | Written by Action Forex | Jan 30 13 15:57 GMT

EUR/USD – 1.3567
Most recent candlesticks pattern : N/A
Trend : Near term up
Tenkan-Sen level              :1.3533
Kijun-Sen level                 :1.3510
Ichimoku cloud top              :1.3446
Ichimoku cloud bottom          :1.3441
Original strategy : 
Buy at 1.3485, Target: 1.3585, Stop: 1.3450
Position: -
Target:  -
Stop:-
New strategy  :  
Buy at 1.3485, Target: 1.3585, Stop: 1.3450
Position: -
Target:  -
Stop:-

As the single currency has maintained a firm undertone after breaking previous resistance at 1.3480, suggesting recent upmove is still in progress (indicated upside target at 1.3545-50 - 61.8% projection of 1.3265-1.3480 measuring from 1.3415 had been met) and further gain towards 1.3600-10 would be seen, however, near term overbought condition should limit upside to 1.3630 (100% projection of 1.3265-1.3480 measuring from 1.3415), risk from there is seen for a retreat later.
In view of this, we are looking to buy euro again on pullback, below 1.3530-35 would bring minor correction to the Kijun-Sen (now at 1.3510) but renewed buying interests should emerge above previous resistance at 1.3480. Below the Ichimoku cloud (now at 1.3441-46) would signal a temporary top is formed and risk correction back to yesterday’s low at 1.3415.

Euro (€) / US Dollar ($) (EUR/USD) Mid-Session Update for January 30, 2013


After an early session breakout through a major 50% price level at 1.3491, the EUR/USD is still showing signs of strength at the mid-session. Now that the market has crossed over to the bullish side of the retracement zone, it is going to have to sustain support over the 50% level or the trend could reverse. 
Besides the retracement zone support, the uptrending Gann angle at 1.3463 is providing guidance and direction. A trade under this angle will be a sign that the trend is weakening. 
Daily EUR/USD Chart
Daily EUR/USD Chart
The 60-minute chart shows that the EUR/USD surged shortly after the European market opened. The first drive was into resistance at 1.3562. This was followed by a near-term correction to 1.3532. The subsequent rally took the market to 1.3577 where is formed a closing price reversal top. My hourly work suggests that a break under 1.3557 could trigger the start of an intraday break. 
 Hourly EUR/USD Chart
Hourly EUR/USD Chart
The first downside target is the uptrending Gann angle from the 1.3532 bottom at 1.3552. Based on the daily range of 1.3481 to 1.3577, a late session sell-off could trigger an even greater break into a retracement zone at 1.3529 to 1.3518. 
Since the main trend is up, 60-minute traders have to watch the action near 1.3532. A trade through this price will turn the main trend down. 

EUR/USD Forecast January 30, 2013, Technical Analysis

The EUR/USD pair fell initially during the Tuesday session, but found enough support at the 1.340 level to bounce and form a fairly positive candle for the day. Just above lies the 1.35 resistance area, an area that is the neckline from a massive inverted head and shoulders. If we can get above that line, we believe this becomes a massive buy-and-hold type of situation as the move measures for a potential target of 1.50! With that being the case, we think that the breakout could happen in the next day or two, and when we get that daily close above the 1.350 level, we are more than willing to start buying.


EUR/USD Forecast January 30, 2013, Technical Analysis

วันอังคารที่ 29 มกราคม พ.ศ. 2556

EUR/USD Forecast January 29, 2013, Technical Analysis


The EUR/USD pair fell most of the session on Monday, but did bounce towards the end of the day also the 1.34 level in order to form a bit of a hammer. This hammer is just below the substantial 1.35 level of resistance, and as a result will be watched very closely by us. If we can get above the 1.35 level on a daily close, which looks more and more likely, we are willing to not only go along of this pair, but hang on to the trade for quite some time.
If we managed to break the 1.35 level, this would be the breaking of a neckline on a massive inverted head and shoulders. This head and shoulders pattern suggests that we will see a print of 1.50 before it’s all said and done. At this rate, it appears that many of the world’s central banks are looking to devalue their currencies at the same time Europe seems to suggest that they are going to do nothing to expand monetary policy, therefore giving traders the “green light” to start buying Euros hand over fist. While this dynamic is in the market, along with both America and Japan printing currency hand over fist, it suggests to us the this pair will continue to grind higher – perhaps over the long run.
If you look at the longer-term charts for this pair, you will notice that the pair could be considered to be in a massive consolidation rectangle. From a longer-term perspective, but 1.20 level offers quite a bit of support while the 1.50 level offers quite a bit of resistance. With that being said, the 1.35 level is exactly halfway between the two and therefore a bit of “equilibrium” in this market. Because of this, it makes sense that the pair is treating this area as this important.
As long as the Federal Reserve continues to weaken the US dollar, we fully expect that the Euro will continue grinding higher. After all, several members of the ECB have recently suggested that they are comfortable with the fact that the Euro is as strong as it is. Also, in a bit of comedy, Mr.Draghi recently suggested that he believed countries would abide by the agreement not to debase currencies and the last G20 meeting. Because of this, it doesn’t look like the ECB is anywhere near doing monetary policy.

EUR/USD Forecast January 29, 2013, Technical Analysis


Trade Idea Wrap-up: EUR/USD – Hold long entered at 1.3410


Candlesticks and Ichimoku Intraday | Written by Action Forex | Jan 28 13 15:42 GMT
EUR/USD – 1.3449
Most recent candlesticks pattern : N/A
Trend : Near term up
Tenkan-Sen level              :1.3451
Kijun-Sen level                 :1.3452
Ichimoku cloud top              :1.3409
Ichimoku cloud bottom          :1.3370
Original strategy : 
Bought at 1.3410, Target: 1.3510, Stop: 1.3420
Position: - Long at 1.3410
Target:  - 1.3510
Stop:- 1.3420
New strategy  :  
Hold long entered at 1.3410, Target: 1.3510, Stop: 1.3420
Position: - Long at 1.3410
Target:  - 1.3510
Stop:- 1.3420
Failure to penetrate Friday’s high of 1.3480 and current retreat suggest consolidation would be seen and intra-day support at 1.3425 needs to hold to retain bullish prospect of another rise, above 1.3480-84 (said resistance and 61.8% projection of 1.3038-1.3404 measuring from 1.3258) would encourage for headway to 1.3500-10 (psychological resistance and 61.8% projection of 1.2998-1.3404 measuring from 1.3258), however, near term overbought condition should prevent sharp move beyond there and risk from there is seen for a correction to take place later.
In view of this, we are holding on to our long position entered at 1.3410. Only below previous resistance at 1.3393-1.3404 would defer and risk correction to the Ichimoku cloud bottom (now at 1.3370), then towards 1.3349 (Friday’s low) before prospect of another rally.

วันจันทร์ที่ 28 มกราคม พ.ศ. 2556

EUR/USD Forecast January 28, 2013, Technical Analysis

The EUR/USD pair had a strong session on Friday, and even threatened to break above the 1.35 handle. In the end it did not however, and as a result that barrier still stands. However, it does look increasingly likely that the 1.35 level will be broken, and this would in turn show a breaking of the neckline from an inverted head and shoulders that could see this pair going as high as 1.50 over the longer term. We obviously can’t sell this pair right now, as it is far too bullish. With that being said, pullback should be a buying opportunity, and obviously a daily close above 1.35 would have us not only bullish this market, but willing to hang onto the trade for ages as well.


EUR/USD Forecast January 28, 2013, Technical Analysis

Weekly Price Action Trading Outlook for January 28th to February 1st 2013


Weekly Price Action Trading Outlook for January 28th to February 1st 2013
EURUSD – Euro/dollar breaks up from recent consolidation, looking for buy signals
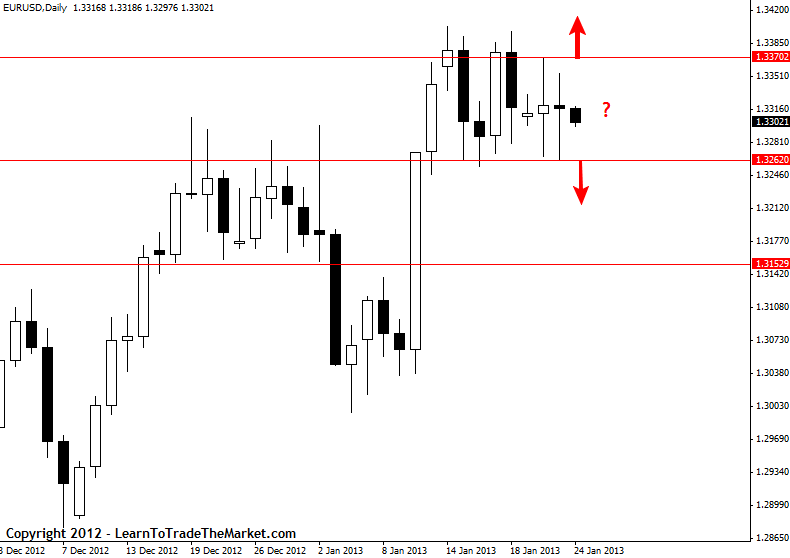
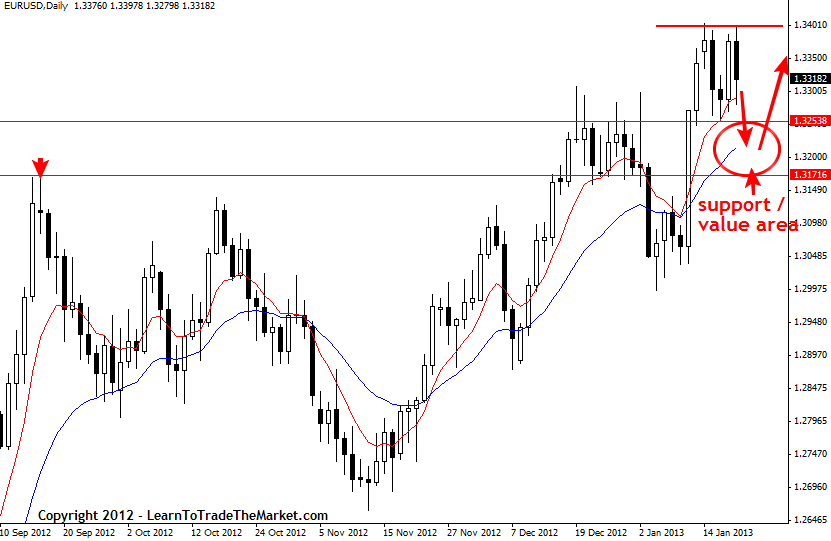
In last Wednesday’s commentary, we discussed the need to see a confirmed breakout one way or the other from consolidation in the EURUSD to open the door for a larger directional move. On Friday, that breakout occurred as the market surged up through 1.3400 and closed well above the previous consolidation range between 1.3400 – 1.3260. The uptrend is clearly still healthy and intact in this market and so this week traders can watch for price action buy signals forming after a rotation back to support / value. The closest and most obvious key support / value area is that previous consolidation between 1.3400 – 1.3260, if we do see price rotate lower this week traders should keep a close eye out for price action strategies forming within that zone to trade back in-line with the uptrend.
eurusd
AUDUSD -  Aussie/dollar loses ground and falls into support
The AUDUSD has moved lower since we last discussed it in last week’s weekly outlook. This market is basically in a trading range and has really not been providing many good setups to trade recently as it oscillates between support and resistance. The market did hit support near 1.0400 on Friday and whether or not that support holds early this week will be important in setting this week’s tone. If the market can hold above that support we could see a grind back up towards resistance, but if it breaks lower we would then watch 1.0345 as the next key support level. If the market breaks below that 1.0345 level it would signal some serious weakness and could be an indication of a larger move lower.
audusd
USDJPY – Dollar/yen up trend still intact, weakness is seen as a potential buying opportunity
The USDJPY uptrend continued to roll on last week, as did the up trends in the other major yen pairs. Our bias for the USDJPY and other yen pairs has not changed; look to buy on weakness pending price action confirmation. In other words, if price rotates down to dynamic 8 / 21 daily EMA support or horizontal support, we will keep our eyes peeled for 4 hour or daily chart price action buy signals to join the uptrend. We want to trade with the trend until it clearly comes to an end, if you need more help on trend trading, checkout this article on how to trade with the trend.
usdjpy

วันศุกร์ที่ 25 มกราคม พ.ศ. 2556

Trade Idea Wrap-up: EUR/USD – Buy at 1.3295


Candlesticks and Ichimoku Intraday | Written by Action Forex | Jan 24 13 15:59 GMT
EUR/USD – 1.3373
Most recent candlesticks pattern : N/A
Trend : Sideways
Tenkan-Sen level              :1.3333
Kijun-Sen level                 :1.3322
Ichimoku cloud top              :1.3319
Ichimoku cloud bottom          :1.3319
New strategy  :  
Buy at 1.3295, Target: 1.3400, Stop: 1.3260
Position: -
Target:  -
Stop:- 


As the single currency has staged a strong rebound after finding good support at 1.3265 yesterday, suggesting a test of 1.3398-1.3404 would be seen, however, break there is needed to confirm early upmove has resumed and extend gain to 1.3440-45 (50% projection of 1.3038-1.3404 measuring from 1.3258), then towards 1.3484 (61.8% projection), however, price should falter well below 1.3500-10 (psychological resistance and 61.8% projection of 1.2998-1.3404 measuring from 1.3258).
In view of this, we are looking to buy euro on pullback. Below said support would risk test of support at 1.3258 but below there is needed to signal a downside break of early established range of 1.3258-1.3404, bring correction of early upmove towards 1.3220-25 (50% Fibonacci retracement of 1.3038-1.3404) but reckon 1.3190-00 would limit downside and bring another rise later.

EUR/USD Forecast January 25, 2013, Technical Analysis


The EUR/USD pair shot straight up during the session on Thursday as the Euro gained against pretty much everything. However, we are still within the consolidation area that is bordered by 1.34 and 1.3250, and as such do not consider this market broken out yet. We definitely favor the upside at this point in time, but recognize that there is probably going to be a ton of resistance between 1.34 and 1.35 going forward.
Having said all that, if we managed to break above the 1.35 level we would be breaking the neckline of a massive inverted head and shoulders. This inverted head and shoulders is so large that it suggests that we would go another 15 handles higher to the 1.50 level. This is a significant move, and can only be thought of as an overall long-term type of trend.
If you have not been trading Forex for over four years, you may not be aware of the fact that he used to be as simple as buying this pair every time it pullback. If we can get above the 1.35 level, it may return to that old type of trading environment. Looking back, it’s easy to see how it would have been some of the easiest money you could’ve made, and as a result we could be entering a new phase in the Forex markets overall.
If we do Internet type of market, you will find that you come back to this pair over and over again, and if it’s anything like it used to be you may even see a lot of traders specializing in just this market. It used to be so profitable that people literally would trade this pair only, with the occasional trade in the cable pair or the Yen.
Looking at this chart, it will more than likely be a serious fight to get to that point. However, it certainly looks like the Euro is starting to pick up steam in the absolute worst fears of a European meltdown have been avoided. With the European Central Bank willing to back up the bond markets on the continent, we may just be entering a new phase in Europe.


EUR/USD Forecast January 25, 2013, Technical Analysis

EUR/USD Forecast January 24, 2013, Technical Analysis


EUR/USD went back and forth during the session on Wednesday a very similar manner as to how I did it on Tuesday. Because of this, the market does look very confused and like it wants to grind around in this consolidation area, leaving us to be essentially neutral on this currency pair at the moment.
Having said that is most certainly in and out trend these days, and as a result we think that eventually we will breakout to the upside. But until we get above the 1.34 level, we have to consider ourselves still within the consolidation area that starts in the 1.3250 level. With that being said, we are flat.


EUR/USD Forecast January 24, 2013, Technical Analysis

Euro (€) / US Dollar ($) (EUR/USD) Mid-Session Update for January 24, 2013


After surviving an attempt earlier in the week to change the trend to down on the daily chart, the EUR/USD rebounded and is now in a position to break out to the upside. Standing in the way of this move is a pair of tops at 1.3397 and 1.3403. 
On the downside, the change in trend level is the January 16 main bottom at 1.3256. A trade through this price will not only change the daily trend to down, but it will also confirm last week’s potentially bearish closing price reversal top. 
Daily EUR/USD
Daily EUR/USD
An uptrending Gann angle at 1.3277 and the pivot price created by the 1.3403 to 1.3256 range at 1.3330 should be considered support levels. Since the market is currently trading over the pivot price, one has to conclude that there is a bias to the upside. 
Monthly EUR/USD
Monthly EUR/USD
The monthly EUR/USD is also indicating a bias to the upside. This month the EUR/USD broke through a long-term Gann angle at 1.3340. Since this angle provided resistance and direction for 20 months, the breakout above it is a significant event. 
Based on the long-term range of 1.4940 to 1.2042, the midpoint at 1.3491 should be considered the next upside target.

วันพฤหัสบดีที่ 24 มกราคม พ.ศ. 2556

Spot Euro Forecast for 23rd January 2013


Spot Euro Forecast for 23rd January 2013
EURUSD failed just below the 100 week moving average at 1.3382, topping at 1.3372 and dived towards 1.3260/30 where we suggested exiting all shorts and buying in to longs expecting a good bounce. The market bottomed at 1.3267 so the levels worked quite well yesterday.
The 100 week moving average at 1.3382 could pose a problem again today and we have resistance again at 1.3395/1.3405 which should remain a very tough obstacle. A good chance therefore of a high for the day again if tested but if we do break above here the next target of 1.3491 should be achieved this week.
1.3310/00 is support but if this is broken we should see a move towards 1.3260/30. Once again we exit all shorts and buy in to longs here expecting a good bounce. We do need a stop loss below 1.3200 however for a test of the next support at 1.3150/25 which should offer an excellent buying opportunity.

EUR/USD Forecast January 23, 2013, Technical Analysis

The EUR/USD pair went back and forth during the session on Tuesday, but closed well above the 1.33 handle. This shows us that 1.33 should continue to offer support, and that the real risk in this pair is probably to the upside. As for selling, we see quite a bit of support all the way down to the 1.32 area, and as a result it will be difficult to do. On the other hand, 1.34 looks to be very resistant at this point, it will be very difficult to break out of. Once we do though, this market should make a beeline towards the 1.35 level and possibly much, much higher.


Trade Idea Wrap-up: EUR/USD – Stand aside


Candlesticks and Ichimoku Intraday | Written by Action Forex | Jan 23 13 15:39 GMT
EUR/USD – 1.3287
Most recent candlesticks pattern : N/A
Trend : Sideways
Tenkan-Sen level              :1.3319
Kijun-Sen level                 :1.3317
Ichimoku cloud top              :1.3319
Ichimoku cloud bottom          :1.3319
New strategy  :  
Stand aside
Position: -
Target:  -
Stop:- 


Despite intra-day rebound to 1.3353, current sharp retreat has retained our view that further choppy consolidation within early established range of 1.3258-1.3404 range would take place and weakness to yesterday’s low of 1.3268 cannot be ruled out, however, breach of support at 1.3258 is needed to signal a downside break of the 1.3258-1.3404 range has occurred and bring correction of early upmove towards 1.3220-25 (50% Fibonacci retracement of 1.3038-1.3404) but reckon 1.3190-00 would limit downside and bring another rise later.
On the upside, above said intra-day resistance would bring test of yesterday’s high of 1.3372 but break there is needed to suggest a possible upside break is underway instead for gain towards last week’s high of 1.3404, having said that, only above there would confirm early upmove has resumed and extend gain to 1.3440-45 (50% projection of 1.3038-1.3404 measuring from 1.3258), then towards 1.3484 (61.8% projection), however, price should falter well below 1.3500-10 (psychological resistance and 61.8% projection of 1.2998-1.3404 measuring from 1.3258).
As near term outlook is still mixed, would be prudent to stand aside for now. 

Forex Market Commentary: EURUSD Continues to Consolidate, 23rd January 2013


Trading Setups / Chart in Focus:
EURUSD – Euro/dollar continues to consolidate
Yesterday, in our members forum I made a post about the EURUSD discussing the potential for a move lower but insisting that we needed to see downside follow through to confirm any short entry. We can see that since then the market has just continued to chop sideways on the 4 hour and daily chart and as of now we are taking a neutral bias on this market.
Anyone looking to trade this market should wait for a convincing break and close above or below this current consolidation range before looking for an entry. Some clues on the intra-day chart would be a strong 4 hour pin bar reversal signal, but even reversals become less effective in consolidation. This market is simply too indecisive right now to try and pick a direction, so traders are going to be best served by exercising caution until we get a strong break out from this current choppy price action.
1358989005-clip-15kb

Euro (€) / US Dollar ($) (EUR/USD) Mid-Session Update for January 23, 2013


A strong surge in the U.S. Dollar is triggering a rapid sell-off in the Euro at the mid-session. The move is also putting a bearish spin on U.S. equity markets which could be a sign of increased demand for lower-yielding assets. 
Although the news isn’t clear at this time, developments in the debt ceiling negotiations may be spooking traders. If the deal to extend the debt ceiling by four months gets taken off the table, the Euro may weaken further as this would indicates a serious shift in sentiment to safety. 
Daily EUR/USD Chart
Daily EUR/USD Chart
Technically, the EUR/USD is trading in a short-term range bounded by 1.3403 to 1.3256. The mid-point or pivot price of this range is 1.3330. For much of the session, the Euro straddled this pivot price, suggesting an indecisive market. Shortly before the mid-session, the market broke sharply, stopping short of an uptrending Gann angle at 1.3257. 
The main bottom at 1.3256 and the Gann angle at 1.3257 combine to form an important support cluster. Because of the downside momentum, traders have to watch this cluster carefully. A failure to hold at this level should trigger a rapid break. Not only will the trend change to down on the trade through 1.3256, but last week’s weekly closing price reversal will also be confirmed. 
Hourly EUR/USD Chart
A confirmation of the weekly reversal will set up a further decline. Since the main range is 1.2997 to 1.3403, traders should watch for a near-term correction into its retracement zone at 1.3200 to 1.3152. 
The 60-minute chart shows that the market has been range bound for several hours. It also shows clearly that a trade through 1.3256 could trigger an acceleration to the downside since the nearest support level is 1.3038. 

วันอังคารที่ 22 มกราคม พ.ศ. 2556

EURUSD Forecast 22/1/2013 Daily


EURUSD 22/1/2013 D1

D1 อาจจะเป็นรูปแบบ Double top ถ้าลงผ่านแนวรับมาได้ก็จะเป็น  Double top ที่สมบูรณ์ โดยส่วนตัวคิดว่าน่าจะลงมายังแนวรับก่อน  แต่เทรนหลักยังเป็นขาขึ้นอยู่

Trade Idea Wrap-up: EUR/USD – Sell at 1.3365

Candlesticks and Ichimoku Intraday | Written by Action Forex Jan 21 13 15:34 GMT
EUR/USD – 1.3313
Most recent candlesticks pattern : N/A
Trend : Up
Tenkan-Sen level              :1.3316
Kijun-Sen level                 :1.3306
Ichimoku cloud top              :1.3347
Ichimoku cloud bottom          :1.3328
Original strategy : 
Sell at 1.3365, Target; 1.3265, Stop: 1.3400
Position: -
Target:  -
Stop:-
New strategy  :  
Sell at 1.3365, Target; 1.3265, Stop: 1.3400
Position: -
Target:  -
Stop:- 

As the single currency has traded narrow after Friday’s retreat from 1.3398 to 1.3281, suggesting further consolidation would be seen and still reckon upside would be limited to 1.3365-75, bring further consolidation below previous resistance at 1.3404, below said support at 1.3281 would bring weakness towards previous support at 1.3258 but sharp fall below 1.3220-25 (50% Fibonacci retracement of 1.3038-1.3404) is not envisaged and renewed buying interests should emerge above 1.3200, bring another rise later.
In view of this, we are looking to turn short on recovery as 1.3370-75 should limit upside. Only above Friday’s high of 1.3398 would shift risk back to upside for a retest of recent high of 1.3404 but break there is needed to confirm early upmove has resumed and extend gain to 1.3440-45 (50% projection of 1.3038-1.3404 measuring from 1.3258), then towards 1.3484 (61.8% projection), however, price should falter well below 1.3500-10 (psychological resistance and 61.8% projection of 1.2998-1.3404 measuring from 1.3258).

Euro (€) / US Dollar ($) (EUR/USD) Mid-Session Update for January 21, 2013


Trading was light on Monday due to a U.S. holiday. Although the EUR/USD is managing to post a small gain, it was range bound. Typically, an inside day indicates impending volatility which we could see when the Forex markets resume their normal activity on Tuesday. 
Based on the short-term range of 1.3403 to 1.3256, the new pivot price is 1.3330. This price is controlling the short-term direction of the market. Since the market is trading below it, there is a slight bias to the downside. 
Daily EUR/USD Chart
Daily EUR/USD Chart
A trade though 1.3256 will confirm last week’s closing price reversal top. This is likely to trigger an acceleration into an uptrending Gann angle from the 1.2997 bottom at 1.3217 today. 
The spiraling action on the 60-minute chart is another indication of impending volatility. The short-term range is 1.3332 to 1.3299. A break out through either price is likely to trigger a volatile move. 
Hourly EUR/USD Chart
A trade through 1.3332 is likely to trigger a move to 1.3370. A move through 1.3299 will likely means a quick test of 1.3280 then 1.3256. 

วันจันทร์ที่ 21 มกราคม พ.ศ. 2556

Weekly Price Action Trading Outlook for January 21st to January 25th 2013


Weekly Price Action Trading Outlook for January 21st to January 25th 2013
EURUSD – Euro/dollar uptrend intact, waiting for a buy signal
The EURUSD entered into a consolidation phase last week after hitting a high of 1.3403 last Monday. The uptrend in this market remains intact, and this week we are waiting for a pullback to support to buy into this uptrend on weakness. If the market rotates down into the 1.3250 – 1.3150 support / value zone we will keep our eyes peeled for a 4 hour or daily chart price action buy signal to trade back in-line with the uptrend.
1358711719-clip-25kb

EUR/USD Forecast January 21, 2013, Technical Analysis


The EUR/USD pair fell during the session on Friday, but remains above the 1.33 support level in order to stay relatively bullish. The pair looks like it’s trying to continue climbing higher, and as a result we think that a bounce is more than likely going to come. We are one willing to start buying here, for short-term gains but we think that the 1.34 level will be resistance for the next couple of sessions. Once we get above the 1.34 level, we think that the 1.35 level will be targeted and a move above that would be a massively bullish sign as it would be breaking the neckline of an inverted head and shoulders. The inverted head and shoulders measures for a move up to the 1.50 level, which of course would be a massive move indeed.
Because of this, we sincerely hope that the pair can break out and look to hold onto any trade that shows inclinations of that. Taken a couple small losses in the process will be nothing compared of the reward that could be had if this trade triggers.
We see the 1.3250 level is extremely supportive below as well, and as a result is going to be almost impossible to short this pair in the meantime. In fact, we think that the pair has plenty of support all the way down to the 1.30 level, and as a result we think that any pullbacks will offer buying opportunities in the near-term.
The European Central Bank has suggested recently that they have no intentions on cutting rates and as a result we should see the Euro continue to be bid up in a fairly healthy manner. This pair should continue to chop along and no fluid movement will probably be seen until we get above the 1.35 level, however there seem to be plenty of headlines that affect this pair every few days, so a sudden move could possibly happen. Again, as for selling we have no interest in doing so until we get below the 1.30 level, and at that point time we would have to think about it a little harder.


EUR/USD Forecast January 21, 2013, Technical Analysis


วันศุกร์ที่ 18 มกราคม พ.ศ. 2556

Trade Idea: EUR/USD – Buy at 1.3330

Candlesticks and Ichimoku Intraday | Written by Action Forex Jan 18 13 06:57 GMT
EUR/USD – 1.3386
Most recent candlesticks pattern : N/A
Trend : Up
Tenkan-Sen level              :1.3377
Kijun-Sen level                 :1.3333
Ichimoku cloud top              :1.3326
Ichimoku cloud bottom          :1.3292
Original strategy : 
Buy at 1.3315, Target: 1.3415, Stop: 1.3280
Position: -
Target:  -
Stop:-
New strategy  :  
Buy at 1.3330, Target: 1.3430, Stop: 1.3295
Position: -
Target:  -
Stop:- 

As the single currency has maintained a firm undertone, suggesting a retest of recent high of 1.3404 would be seen, break there would confirm early upmove has resumed and extend gain to 1.3440-45 (50% projection of 1.3038-1.3404 measuring from 1.3258) but reckon 1.3484 (61.8% projection) would hold from here, price should falter well below 1.3500-10 (psychological resistance and 61.8% projection of 1.2998-1.3404 measuring from 1.3258). 
In view of this, we are looking to buy euro on dips as the Kijun-Sen (now at 1.3333) should limit downside. Only below the Ichimoku cloud bottom (now at 1.3292) would defer and prolong consolidation, risk test of yesterday’s low at 1.3270 and possibly to previous support at 1.3258 but reckon 1.3220-25 (50% Fibonacci retracement of 1.3038-1.3404) would limit downside.

EUR/USD Forecast January 18, 2013, Technical Analysis

EUR/USD pair had a strong showing on Thursday as we bounced from the 1.33 handle and closed near the recent highs at 1.34. In fact, it appears that we are dead set on testing that level again and perhaps pressing to the 1.35 level in the short-term. If we managed to get to 1.35 and break above it, this suddenly becomes a long-term buy-and-hold type of proposition. On the other hand, if we managed to break down below the 1.3250 level, we would suspect that this pair is going to break down a little bit. Nonetheless, it appears that bullishness prevails in this market and 1.35 is much more likely than 1.32 at this point.


Credit : FX Empire Analyst - Christopher Lewis

Euro (€) / US Dollar ($) (EUR/USD) Mid-Session Update for January 17, 2013


A well-received Spanish auction turned the EUR/USD higher early in the session and the Forex pair never looked back. Volatility is high today after the early rebound, erasing all of the loss from earlier in the week. 
Strong momentum is driving the Euro higher against the dollar at the mid-session with the market rapidly approaching this week’s high at 1.3403. A breakout above this level will put the market on pace to make a 10-month high. 
Daily EUR/USD Chart
Daily EUR/USD Chart
One sign of strength is the Euro’s ability to overcome a short-term retracement zone at 1.3330 to 1.3347. This area is now intraday support. The next sign of strength will be crossing over to the bullish side of a steep uptrending Gann angle at 1.3357. This move could set off a strong rally. 
The main trend is up. A rally through 1.3403 should trigger a breakout to the upside with 1.3491 the next likely downside target. A trade through 1.3256 will turn the minor trend down. It will also serve as a sign that investor sentiment is shifting to the downside. If this occurs, look for the start of a move to 1.3200.

วันพฤหัสบดีที่ 17 มกราคม พ.ศ. 2556

EUR/USD Forecast January 17, 2013, Technical Analysis

The EUR/USD pair fell during the session on Wednesday as the bearishness continued in the Euro. However, we are starting find support just below the 1.33 handle, and as a result it looks like the buyers may step back into the marketplace. Also of note is the fact that there seemed to be a lot of pairs that look like they’re about to turn “risk on” at the end of the session on Wednesday, and as a result we may see a general running from the US dollar. The certainly won’t hurt this pair, and as a result we should see much higher prices. On a break of the highs from the Wednesday session, we are more than willing to start buying at that point.


EUR/USD Forecast January 17, 2013, Technical Analysis

EURUSD Forecast 17/1/2013 Daily


EURUSD 17/1/2013 H4

ยังมองว่าเป็นขาขึ้นอยู่ ให้หาจังหวะ Buy  TPแรกที่ Hi เดิม

EUR/USD Forecast January 16, 2013, Technical Analysis

The EUR/USD pair fell during the session on Tuesday, as and found support somewhere around the 1.3280 level. With this being said, it looks visible pullback after the breakout and now we have to wait and see if we get the supportive action in order to start buying again. Because of this, we are still bullish of the Euro, but recognize the fact that we need to be a little bit more patient in order to get a “clear signal.” Going forward, we still think this market goes higher and as a result we are not looking to sell now, rather simply being patient enough to see a hammer or other such bullish candles in order to start buying.


EUR/USD Forecast January 16, 2013, Technical Analysis


Euro (€) / US Dollar ($) (EUR/USD) Mid-Session Update for January 16, 2013


The EUR/USD is trading slightly better at the mid-session in a lackluster trade. Traders may be sitting on their hands until after the release of the Fed’s Beige Book at 2 p.m. Eastern. 
The main trend is up on the daily chart. Last night’s penetration of the previous day’s low at 1.3263 helped to form a new main top at 1.3403. The new short-term range is 1.3403 to 1.3256 with a new retracement zone at 1.3330 to 1.3347. 
Daily EUR/USD Chart
Daily EUR/USD Chart
Downtrending Gann angle resistance is at 1.3323 and 1.3363. The first angle was tested this morning and triggered a technical bounce. The second angle forms a possible upside target and resistance cluster at 1.3343 to 1.3347 on Thursday. 
It is possible that the market is trying to complete a secondary top. This is likely to occur inside the retracement zone at 1.3330 to 1.3347. If the market fails inside this zone then look for the start of another break. The next major downside target is the retracement zone formed by 1.2997 to 1.3403 at 1.3200 to 1.3152.